用Python创建漂亮的架构图( 二 )
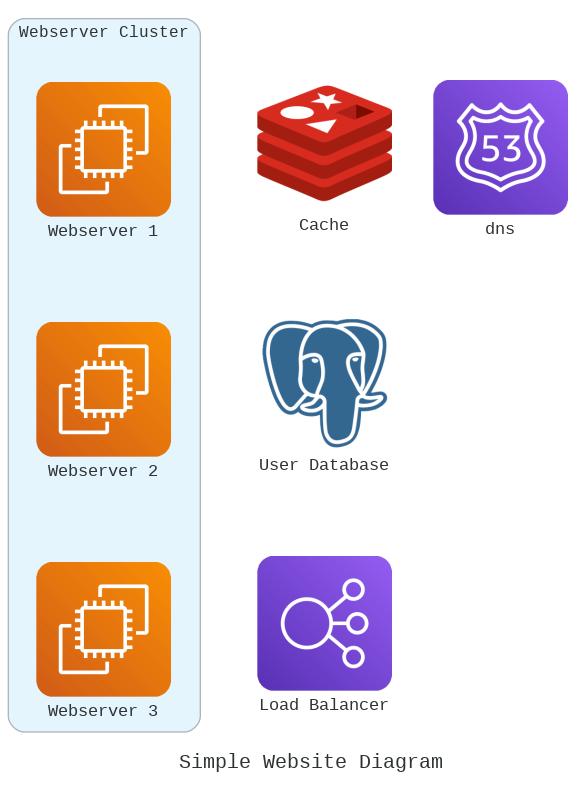
在下面您可以看到 , 要做到这一点 , 我们只需要将节点的实例移动到我们正在创建的集群范围内即可 。
from diagrams import Diagram, Clusterfrom diagrams.aws.compute import EC2from diagrams.aws.network import ELBfrom diagrams.aws.network import Route53from diagrams.onprem.database import PostgreSQL # Would typically use RDS from aws.databasefrom diagrams.onprem.inmemory import Redis # Would typically use ElastiCache from aws.databasewith Diagram("Simple Website Diagram") as diag:dns = Route53("dns")load_balancer = ELB("Load Balancer")database = PostgreSQL("User Database")cache = Redis("Cache")with Cluster("Webserver Cluster"):svc_group = [EC2("Webserver 1"),EC2("Webserver 2"),EC2("Webserver 3")]diag如您所见 , 该图仍然只是节点列表 , 但是现在我们将适当的节点聚类为逻辑分组 。 文章插图
文章插图
> Build with the code from the gist linked here.
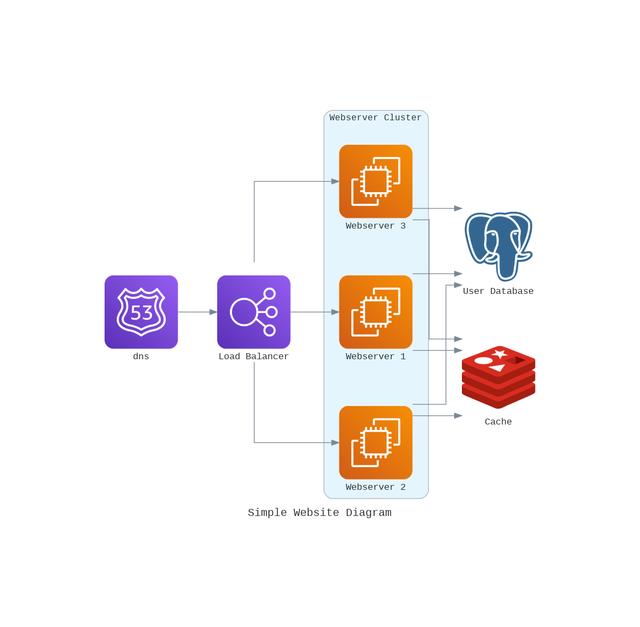
步骤4:将所有内容连接在一起在最后一步中 , 我们将不会链接刚刚安排要在架构中使用的节点 。当我需要更新或调整架构时 , 此任务使我花费的时间最长 。如果您在下面看一下 , 只需用双箭头定义流到每个节点的流程就可以了! 在此示例中 , 我们将仅链接不带标签的节点 , 但是如果您看一下将标签应用于链接的文档 , 这是一项非常简单的任务 。
from diagrams import Diagram, Clusterfrom diagrams.aws.compute import EC2from diagrams.aws.network import ELBfrom diagrams.aws.network import Route53from diagrams.onprem.database import PostgreSQL # Would typically use RDS from aws.databasefrom diagrams.onprem.inmemory import Redis # Would typically use ElastiCache from aws.databasewith Diagram("Simple Website Diagram", direction='LR') as diag: # It's LR by default, but you have a few options with the orientationdns = Route53("dns")load_balancer = ELB("Load Balancer")database = PostgreSQL("User Database")cache = Redis("Cache")with Cluster("Webserver Cluster"):svc_group = [EC2("Webserver 1"),EC2("Webserver 2"),EC2("Webserver 3")]dns >> load_balancer >> svc_groupsvc_group >> cachesvc_group >> databasediag生成的图像可以在下面看到 , 现在您可以看到图中每个节点之间的逻辑流程 。可以通过更改定义节点的顺序来逆转此流程 。除了调整流程外 , 您还可以更改许多内容 , 因为边缘对象包含三个属性:标签 , 颜色和样式 。我们不会在这里介绍如何柚木 。如果您有兴趣了解更多信息 , 请参见本文结尾处的文档链接 , 并且这些属性反映了对应的graphviz边缘属性 , 如果您过去使用该工具可以简化事情 。 文章插图
文章插图
> Build with the code from the gist linked here.
结论现在 , 您已下定决心用代码构建漂亮的图 , 在涉及自动化的可能性以及利用体系结构图的常规维护节省时间的情况下 , 利用此工作流程有很大的潜力 。
单独使用此工具节省的时间将使我将来使用这种方法 。我当然不会错过对图进行手动调整 , 仔细对齐组件和箭头以及我的体系结构的每次迭代所涉及的工作 。
我希望我的经验对使用代码构建图很有兴趣 , 并且对将来的图表工作很有用 。谢谢阅读!
(本文翻译自Dylan Roy的文章《Create Beautiful Architecture Diagrams with Python》 , 参考:)
- 看不上|为什么还有用户看不上华为Mate40系列来看看内行人怎么说
- 采用|消息称一加9系列将推出三款新机,新增一加9E
- 会员|美容院使用会员管理软件给顾客更好的消费体验!
- 行业|现在行业内客服托管费用是怎么算的
- 闲鱼|电诉宝:“闲鱼”网络欺诈成用户投诉热点 Q3获“不建议下单”评级
- 美国|英国媒体惊叹:165个国家采用北斗将GPS替代,连美国也不例外?
- 桌面|日常使用的软件及网站分享 篇一:几个动态壁纸软件和静态壁纸网站:助你美化你的桌面
- 同轴心配合|用SolidWorks画一个直角传动,画四个零件就行
- 先别|用了周冬雨的照片,我会成为下一个被告?自媒体创作者先别自乱阵脚
- 速度|华为P50Pro或采用很吓人的拍照技术:液体镜头让对焦速度更快
