就“过滤”而言 , 我们有很多类型的过滤器 。 比如模糊滤镜、锐化滤镜、变亮、变暗、边缘检测等滤镜 。
下面用一些代码片段来理解过滤器的特征:
Import matplotlib.pyplot as pltImport matplotib.image as mpimgImport cv2Import numpy as npImage = mpimg.imread(‘dog.jpg’)Plt.imshow(image)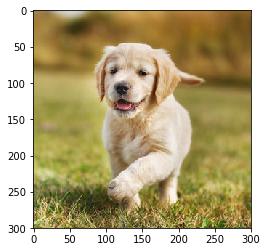 文章插图
文章插图
# 转换为灰度图gray = cv2.cvtColor(image, cv2.COLOR_RB2GRAY)# 定义sobel过滤器sobel = np.array([-1, -2, -1],[0, 0, 0],[1, 2, 1]))# 应用sobel过滤器Filtered_image = cv2.filter2D(gray, -1, sobel_y)# 画图Plt.imshow(filtered_image, cmp=’gray’)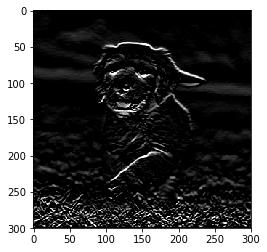 文章插图
文章插图
以上是应用sobel边缘检测滤镜后图像的样子 ,可以看到检测出轮廓信息 。
完整的CNN结构
到目前为止 , 已经看到了如何使用滤镜从图像中提取特征 。 现在要完成整个卷积神经网络 , cnn使用的层是:
- 1.卷积层(Convolutional layer)
- 2.池层(Pooling layer)
- 3.全连接层(fully connected layer)
 文章插图
文章插图下面让我们看看每个图层起到的的作用:
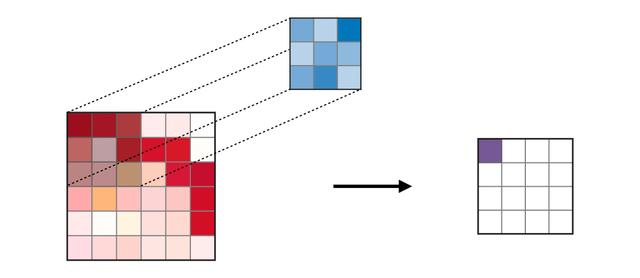
* 卷积层(CONV)——使用过滤器执行卷积操作 。 因为它扫描输入图像的尺寸 。 它的超参数包括滤波器大小 , 可以是2x2、3x3、4x4、5x5(或其它)和步长S 。 结果输出O称为特征映射或激活映射 , 具有使用输入层计算的所有特征和过滤器 。 下面描绘了应用卷积的工作过程:
 文章插图
文章插图卷积运算
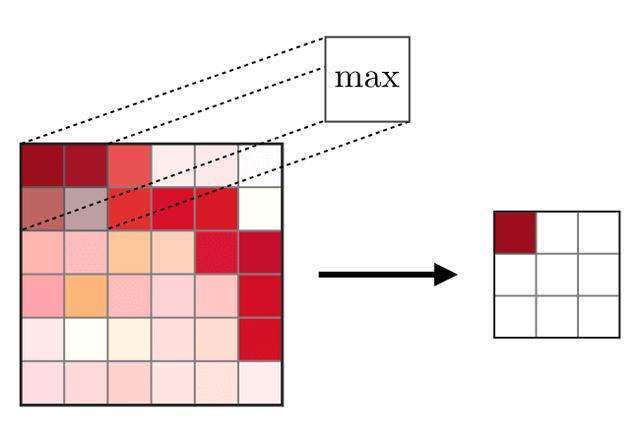
- 池化层(POOL)——用于特征的下采样 , 通常在卷积层之后应用 。 池化处理方式有多种类型 , 常见的是最大池化(max pooling)和平均池化(ave pooling) , 分别采用特征的最大值和平均值 。 下面描述了池化的工作过程:
 文章插图
文章插图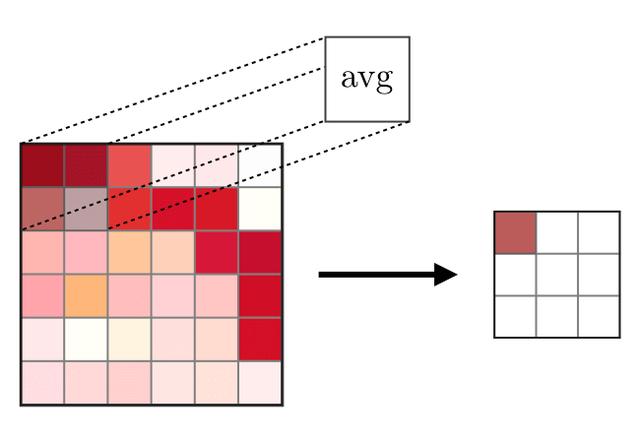 文章插图
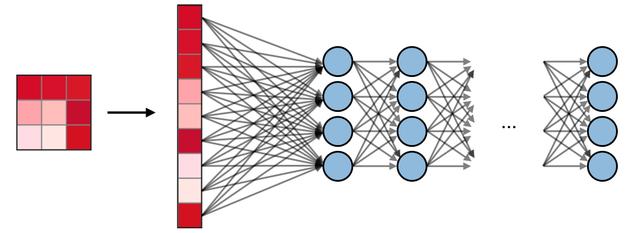
文章插图- ?全连接层(FC)——在展开的特征上进行操作 , 其中每个输入连接到所有的神经元 , 通常在网络末端用于将隐藏层连接到输出层 , 下图展示全连接层的工作过程:
 文章插图
文章插图在PyTorch中可视化CNN
在了解了CNN网络的全部构件后 , 现在让我们使用PyTorch框架实现CNN 。
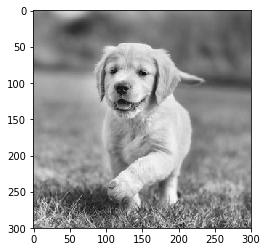
步骤1:加载输入图像:
import cv2import matplotlib.pyplot as plt%matplotlib inlineimg_path = 'dog.jpg'bgr_img = cv2.imread(img_path)gray_img = cv2.cvtColor(bgr_img, cv2.COLOR_BGR2GRAY)# Normalisegray_img = gray_img.astype("float32")/255plt.imshow(gray_img, cmap='gray')plt.show()
 文章插图
文章插图步骤2:可视化过滤器
对过滤器进行可视化 , 以更好地了解将使用哪些过滤器:
import numpy as npfilter_vals = np.array([ [-1, -1, 1, 1], [-1, -1, 1, 1], [-1, -1, 1, 1], [-1, -1, 1, 1]])print('Filter shape: ', filter_vals.shape)# Defining the Filtersfilter_1 = filter_valsfilter_2 = -filter_1filter_3 = filter_1.Tfilter_4 = -filter_3filters = np.array([filter_1, filter_2, filter_3, filter_4])# Check the Filtersfig = plt.figure(figsize=(10, 5))for i in range(4): ax = fig.add_subplot(1, 4, i+1, xticks=[], yticks=[]) ax.imshow(filters[i], cmap='gray') ax.set_title('Filter %s' % str(i+1)) width, height = filters[i].shape for x in range(width): for y in range(height): ax.annotate(str(filters[i][x][y]), xy=(y,x), color='white' if filters[i][x][y]
- 三星发布新电视:99.99%屏占比 8K输出
- Facebook Messenger收集的数据量有多吓人?可视化对比图告诉你
- 数据可视化三节课之二:可视化的使用
- 历时 1 个月,做了 10 个 Python 可视化动图,用心且精美...
- 公牛推出电竞充电器,1A1C双输出,集成能量呼吸灯
- 在Linux系统中安装深度学习框架Pytorch
- 为何学习编程往往都是从编写输出HelloWorld的程序开始
- MOMAX推出20W 1A1C PD充电器,支持双口输出
- 数据|南方电网超高压公司成功举办首届数据可视化分析大赛
- 30行Python代码实现3D数据可视化!非常惊艳
