R语言进行Twitter数据可视化( 二 )
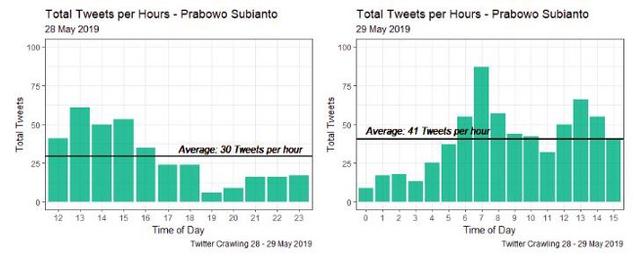
# 2019-05-28的推特ggplot(data.hour.date1)+geom_bar(aes(x = Hour,y = Total.Tweets,fill = I('red')),stat = 'identity',alpha = 0.75,show.legend = FALSE)+geom_hline(yintercept = mean(data.hour.date1$Total.Tweets),col = I('black'),size = 1)+geom_text(aes(fontface = 'italic',label = paste('Average:',ceiling(mean(data.hour.date1$Total.Tweets)),'Tweets per hour'),x = 6.5,y = mean(data.hour.date1$Total.Tweets)+5),hjust = 'left',size = 4)+labs(title = 'Total Tweets per Hours - Prabowo Subianto',subtitle = '28 May 2019',caption = 'Twitter Crawling 28 - 29 May 2019')+xlab('Time of Day')+ylab('Total Tweets')+ylim(c(0,100))+theme_bw()+scale_fill_brewer(palette = 'Dark2')# 2019-05-29的推特ggplot(data.hour.date2)+geom_bar(aes(x = Hour,y = Total.Tweets,fill = I('red')),stat = 'identity',alpha = 0.75,show.legend = FALSE)+geom_hline(yintercept = mean(data.hour.date2$Total.Tweets),col = I('black'),size = 1)+geom_text(aes(fontface = 'italic',label = paste('Average:',ceiling(mean(data.hour.date2$Total.Tweets)),'Tweets per hour'),x = 1,y = mean(data.hour.date2$Total.Tweets)+6),hjust = 'left',size = 4)+labs(title = 'Total Tweets per Hours - Prabowo Subianto',subtitle = '29 May 2019',caption = 'Twitter Crawling 28 - 29 May 2019')+xlab('Time of Day')+ylab('Total Tweets')+ylim(c(0,100))+theme_bw()+scale_fill_brewer(palette = 'Dark2') 文章插图
文章插图
根据图2 , 我们得到了使用关键字“Joko Widodo”和“Prabowo Subianto”的用户之间的显著差异 。 关键词为“Joko Widodo”的tweet在某个特定时间(07:00–09:00 WIB)谈论Joko Widodo往往非常激烈 , 08:00 WIB的tweet数量最多 。 它有348条推文 。 然而 , 在2019年5月28日至29日期间 , 关键词为“Prabowo Subianto”的推文往往会不断地谈论Prabowo Subianto 。 2019年5月28日至29日 , 每小时上传关键词为“Prabowo Subianto”的推文平均为36条 。
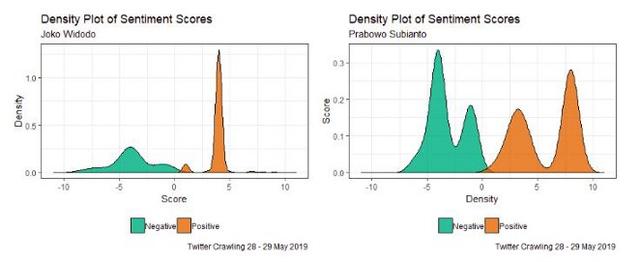
# JOKO WIDODOdf.score.1 = subset(senti.jokowi,class == c('Negative','Positive'))colnames(df.score.1) = c('Score','Text','Sentiment')# Data vizggplot(df.score.1)+geom_density(aes(x = Score,fill = Sentiment),alpha = 0.75)+xlim(c(-11,11))+labs(title = 'Density Plot of Sentiment Scores',subtitle = 'Joko Widodo',caption = 'Twitter Crawling 28 - 29 May 2019')+xlab('Score')+ylab('Density')+theme_bw()+scale_fill_brewer(palette = 'Dark2')+theme(legend.position = 'bottom',legend.title = element_blank())# PRABOWO SUBIANTOdf.score.2 = subset(senti.prabowo,class == c('Negative','Positive'))colnames(df.score.2) = c('Score','Text','Sentiment')ggplot(df.score.2)+geom_density(aes(x = Score,fill = Sentiment),alpha = 0.75)+xlim(c(-11,11))+labs(title = 'Density Plot of Sentiment Scores',subtitle = 'Prabowo Subianto',caption = 'Twitter Crawling 28 - 29 May 2019')+xlab('Density')+ylab('Score')+theme_bw()+scale_fill_brewer(palette = 'Dark2')+theme(legend.position = 'bottom',legend.title = element_blank()) 文章插图
文章插图
图3是2019年5月28日至29日以“Joko Widodo”和“Prabowo Subianto”为关键词的多条推文的条形图 。 由图3(左)可以得出 , Twitter用户在19:00-23:59 WIB上谈论Prabowo Subianto的频率较低 。 这是由于印尼人的休息时间造成的 。 然而 , 这些带有主题的推文总是在午夜更新 , 因为有的用户居住在国外 , 有的用户仍然活跃 。 然后 , 用户在04:00 WIB开始活动 , 在07:00 WIB达到高峰 , 然后下降 , 直到12:00 WIB再次上升 。
# JOKO WIDODOdf.senti.score.1 = data.frame(table(senti.jokowi$score))colnames(df.senti.score.1) = c('Score','Freq')# 数据预处理df.senti.score.1$Score = as.character(df.senti.score.1$Score)df.senti.score.1$Score = as.numeric(df.senti.score.1$Score)Score1 = df.senti.score.1$Scoresign(df.senti.score.1[1,1])for (i in 1:nrow(df.senti.score.1)) {sign.row = sign(df.senti.score.1[i,'Score'])for (j in 1:ncol(df.senti.score.1)) {df.senti.score.1[i,j] = df.senti.score.1[i,j] * sign.row}}df.senti.score.1$Label = c(letters[1:nrow(df.senti.score.1)])df.senti.score.1$Sentiment = ifelse(df.senti.score.1$Freq < 0,'Negative','Positive')df.senti.score.1$Score1 = Score1# 数据可视化ggplot(df.senti.score.1)+geom_bar(aes(x = Label,y = Freq,fill = Sentiment),stat = 'identity',show.legend = FALSE)+# 积极情感geom_hline(yintercept = mean(abs(df.senti.score.1[which(df.senti.score.1$Sentiment == 'Positive'),'Freq'])),col = I('black'),size = 1)+geom_text(aes(fontface = 'italic',label = paste('Average Freq:',ceiling(mean(abs(df.senti.score.1[which(df.senti.score.1$Sentiment == 'Positive'),'Freq'])))),x = 10,y = mean(abs(df.senti.score.1[which(df.senti.score.1$Sentiment == 'Positive'),'Freq']))+30),hjust = 'right',size = 4)+# 消极情感geom_hline(yintercept = mean(df.senti.score.1[which(df.senti.score.1$Sentiment == 'Negative'),'Freq']),col = I('black'),size = 1)+geom_text(aes(fontface = 'italic',label = paste('Average Freq:',ceiling(mean(abs(df.senti.score.1[which(df.senti.score.1$Sentiment == 'Negative'),'Freq'])))),x = 5,y = mean(df.senti.score.1[which(df.senti.score.1$Sentiment == 'Negative'),'Freq'])-15),hjust = 'left',size = 4)+labs(title = 'Barplot of Sentiments',subtitle = 'Joko Widodo',caption = 'Twitter Crawling 28 - 29 May 2019')+xlab('Score')+scale_x_discrete(limits = df.senti.score.1$Label,labels = df.senti.score.1$Score1)+theme_bw()+scale_fill_brewer(palette = 'Dark2')# PRABOWO SUBIANTOdf.senti.score.2 = data.frame(table(senti.prabowo$score))colnames(df.senti.score.2) = c('Score','Freq')# 数据预处理df.senti.score.2$Score = as.character(df.senti.score.2$Score)df.senti.score.2$Score = as.numeric(df.senti.score.2$Score)Score2 = df.senti.score.2$Scoresign(df.senti.score.2[1,1])for (i in 1:nrow(df.senti.score.2)) {sign.row = sign(df.senti.score.2[i,'Score'])for (j in 1:ncol(df.senti.score.2)) {df.senti.score.2[i,j] = df.senti.score.2[i,j] * sign.row}}df.senti.score.2$Label = c(letters[1:nrow(df.senti.score.2)])df.senti.score.2$Sentiment = ifelse(df.senti.score.2$Freq
- 设计语言|全新家族设计,三星Galaxy A32渲染图曝光
- 信服|深信服何朝曦:安全不能只面向静态风险进行建设,应该从"面向风险"转向"面向能力"
- Twitter|Twitter的Audio Spaces测试包括转录、扬声器控制和报告功能
- 要来|折叠屏iPhone要来了?传已送至富士康进行测试
- 目标和意义进行|关于智能的新思考:我们为什么探索性提出智能三定律?
- 曝光|微软新专利曝光 可以与会者面部表情和肢体语言为会议打分
- 学习C语言的软件,就突然被我绿了?
- Linux 之父对 C++ 进行了炮轰,C++不值得推荐?
- 关系数据源|业务人员可以进行自助ETL操作?这款BI工具你值得拥有
- LeetCode第1 题:两数之和 Go语言精解
