R语言进行Twitter数据可视化( 三 )
 文章插图
文章插图
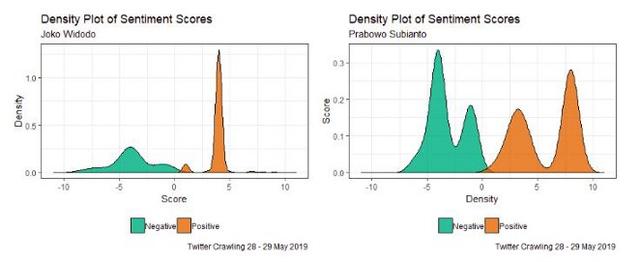
图3是2019年5月28日至29日以“Joko Widodo”和“Prabowo Subianto”为关键词的多条推文的条形图 。 由图3(左)可以得出 , Twitter用户在19:00-23:59 WIB上谈论Prabowo Subianto的频率较低 。 这是由于印尼人的休息时间造成的 。 然而 , 这些带有主题的推文总是在午夜更新 , 因为有的用户居住在国外 , 有的用户仍然活跃 。 然后 , 用户在04:00 WIB开始活动 , 在07:00 WIB达到高峰 , 然后下降 , 直到12:00 WIB再次上升 。
# JOKO WIDODOdf.senti.score.1 = data.frame(table(senti.jokowi$score))colnames(df.senti.score.1) = c('Score','Freq')# 数据预处理df.senti.score.1$Score = as.character(df.senti.score.1$Score)df.senti.score.1$Score = as.numeric(df.senti.score.1$Score)Score1 = df.senti.score.1$Scoresign(df.senti.score.1[1,1])for (i in 1:nrow(df.senti.score.1)) {sign.row = sign(df.senti.score.1[i,'Score'])for (j in 1:ncol(df.senti.score.1)) {df.senti.score.1[i,j] = df.senti.score.1[i,j] * sign.row}}df.senti.score.1$Label = c(letters[1:nrow(df.senti.score.1)])df.senti.score.1$Sentiment = ifelse(df.senti.score.1$Freq < 0,'Negative','Positive')df.senti.score.1$Score1 = Score1# 数据可视化ggplot(df.senti.score.1)+geom_bar(aes(x = Label,y = Freq,fill = Sentiment),stat = 'identity',show.legend = FALSE)+# 积极情感geom_hline(yintercept = mean(abs(df.senti.score.1[which(df.senti.score.1$Sentiment == 'Positive'),'Freq'])),col = I('black'),size = 1)+geom_text(aes(fontface = 'italic',label = paste('Average Freq:',ceiling(mean(abs(df.senti.score.1[which(df.senti.score.1$Sentiment == 'Positive'),'Freq'])))),x = 10,y = mean(abs(df.senti.score.1[which(df.senti.score.1$Sentiment == 'Positive'),'Freq']))+30),hjust = 'right',size = 4)+# 消极情感geom_hline(yintercept = mean(df.senti.score.1[which(df.senti.score.1$Sentiment == 'Negative'),'Freq']),col = I('black'),size = 1)+geom_text(aes(fontface = 'italic',label = paste('Average Freq:',ceiling(mean(abs(df.senti.score.1[which(df.senti.score.1$Sentiment == 'Negative'),'Freq'])))),x = 5,y = mean(df.senti.score.1[which(df.senti.score.1$Sentiment == 'Negative'),'Freq'])-15),hjust = 'left',size = 4)+labs(title = 'Barplot of Sentiments',subtitle = 'Joko Widodo',caption = 'Twitter Crawling 28 - 29 May 2019')+xlab('Score')+scale_x_discrete(limits = df.senti.score.1$Label,labels = df.senti.score.1$Score1)+theme_bw()+scale_fill_brewer(palette = 'Dark2')# PRABOWO SUBIANTOdf.senti.score.2 = data.frame(table(senti.prabowo$score))colnames(df.senti.score.2) = c('Score','Freq')# 数据预处理df.senti.score.2$Score = as.character(df.senti.score.2$Score)df.senti.score.2$Score = as.numeric(df.senti.score.2$Score)Score2 = df.senti.score.2$Scoresign(df.senti.score.2[1,1])for (i in 1:nrow(df.senti.score.2)) {sign.row = sign(df.senti.score.2[i,'Score'])for (j in 1:ncol(df.senti.score.2)) {df.senti.score.2[i,j] = df.senti.score.2[i,j] * sign.row}}df.senti.score.2$Label = c(letters[1:nrow(df.senti.score.2)])df.senti.score.2$Sentiment = ifelse(df.senti.score.2$Freq < 0,'Negative','Positive')df.senti.score.2$Score1 = Score2# 数据可视化ggplot(df.senti.score.2)+geom_bar(aes(x = Label,y = Freq,fill = Sentiment),stat = 'identity',show.legend = FALSE)+# 积极情感geom_hline(yintercept = mean(abs(df.senti.score.2[which(df.senti.score.2$Sentiment == 'Positive'),'Freq'])),col = I('black'),size = 1)+geom_text(aes(fontface = 'italic',label = paste('Average Freq:',ceiling(mean(abs(df.senti.score.2[which(df.senti.score.2$Sentiment == 'Positive'),'Freq'])))),x = 11,y = mean(abs(df.senti.score.2[which(df.senti.score.2$Sentiment == 'Positive'),'Freq']))+20),hjust = 'right',size = 4)+# 消极情感geom_hline(yintercept = mean(df.senti.score.2[which(df.senti.score.2$Sentiment == 'Negative'),'Freq']),col = I('black'),size = 1)+geom_text(aes(fontface = 'italic',label = paste('Average Freq:',ceiling(mean(abs(df.senti.score.2[which(df.senti.score.2$Sentiment == 'Negative'),'Freq'])))),x = 9,y = mean(df.senti.score.2[which(df.senti.score.2$Sentiment == 'Negative'),'Freq'])-10),hjust = 'left',size = 4)+labs(title = 'Barplot of Sentiments',subtitle = 'Prabowo Subianto',caption = 'Twitter Crawling 28 - 29 May 2019')+xlab('Score')+scale_x_discrete(limits = df.senti.score.2$Label,labels = df.senti.score.2$Score1)+theme_bw()+scale_fill_brewer(palette = 'Dark2')
- 微软|外媒:微软将对Windows 10界面进行彻底改进 已招兵买马
- Linux 5.11开始围绕PCI Express 6.0进行早期准备
- AMP Robotics募资5500万美元 开发AI对可回收物进行分拣
- Mozilla正在对Firefox设计进行更新工作
- 为什么我喜欢C语言,却非常讨厌C++?一位国外程序员的回答
- iPhone 13仍将有四款型号 Pro版屏幕进行重大升级
- 谷歌对内部论文进行“敏感问题”审查!讲坏话的不许发
- Java语言会不会随着容器的兴起而衰落
- 大数据专业本科生选择主攻Python语言,如何提升就业竞争力
- 获评IDC 报告7项第一,阿里语音语言AI领跑云厂商
