30行Python代码实现3D数据可视化!非常惊艳( 二 )
 文章插图
文章插图
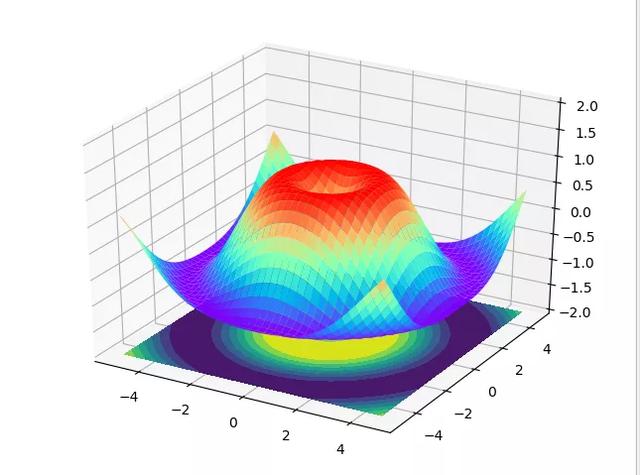
帽子图2
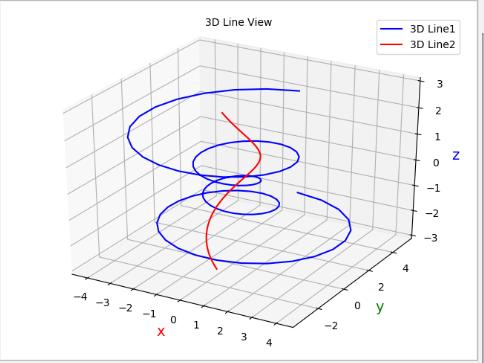
3D 线性图3D 线性图使用 Axes3D.plot来绘制 。 绘画的基本方法:Axes3D.plot(xs, ys[, zs, zdir='z', *args, **kwargs])
参数说明:
参数描述xs一维数组 , 点的 x 轴坐标ys一维数组 , 点的 y 轴坐标zs一维数组 , 可选项 , 点的 z 轴坐标zdir可选项 , 在 3D 轴上绘制 2D 数据时 , 数据必须以 xs , ys 的形式传递 , 若此时将 zdir 设置为 ‘y’ , 数据将会被绘制到 x-z 轴平面上 , 默认为 ‘z’**kwargs其他关键字参数 , 可选项 , 可参见 matplotlib.axes.Axes.plot
import numpy as npimport matplotlib.pyplot as pltfrom mpl_toolkits.mplot3d import Axes3D# 依次获取画布和绘图区并创建 Axes3D 对象fig = plt.figure()ax = fig.gca(projection='3d')# 第一条3D线性图数据theta = np.linspace(-4 * np.pi, 4 * np.pi, 100)z1 = np.linspace(-2, 2, 100)r = z1**2 + 1x1 = r * np.sin(theta)y1 = r * np.cos(theta)# 第二条3D线性图数据z2 = np.linspace(-3, 3, 100)x2 = np.sin(z2)y2 = np.cos(z2)# 绘制3D线性图ax.plot(x1, y1, z1, color='b', label='3D Line1')ax.plot(x2, y2, z2, color='r', label='3D Line2')# 设置标题、轴标签、图例 , 也可以直接使用 plt.title、plt.xlabel、plt.legend...ax.set_title('3D Line View', pad=15, fontsize='10')ax.set_xlabel('x ', color='r', fontsize='14')ax.set_ylabel('y ', color='g', fontsize='14')ax.set_zlabel('z ', color='b', fontsize='14')ax.legend()plt.show()结果显示:
 文章插图
文章插图
线性图
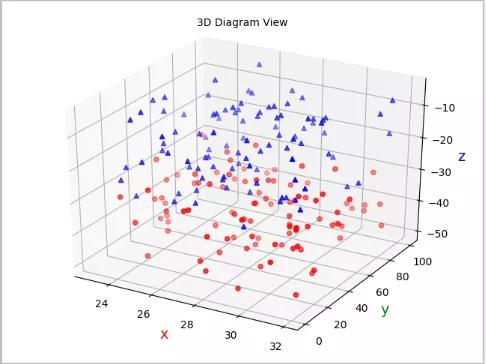
3D 散点图绘制 3D 散点图的基本方法是:Axes3D.scatter(xs, ys[, zs=0, zdir='z', s=20, c=None, depthshade=True, *args, **kwargs])
参数详解:
参数描述xs一维数组 , 点的 x 轴坐标ys一维数组 , 点的 y 轴坐标zs一维数组 , 可选项 , 点的 z 轴坐标zdir可选项 , 在 3D 轴上绘制 2D 数据时 , 数据必须以 xs , ys 的形式传递 , 若此时将 zdir 设置为 ‘y’ , 数据将会被绘制到 x-z 轴平面上 , 默认为 ‘z’s标量或数组类型 , 可选项 , 标记的大小 , 默认 20c标记的颜色 , 可选项 , 可以是单个颜色或者一个颜色列表支持英文颜色名称及其简写、十六进制颜色码等 , 更多颜色示例参见官网 Color Demodepthshadebool 值 , 可选项 , 默认 True , 是否为散点标记着色以提供深度外观**kwargs其他关键字
import matplotlib.pyplot as pltimport numpy as npfrom mpl_toolkits.mplot3d import Axes3Ddef randrange(n, vmin, vmax):return (vmax - vmin) * np.random.rand(n) + vminfig = plt.figure()ax = fig.add_subplot(111, projection='3d')n = 100# For each set of style and range settings, plot n random points in the box# defined by x in [23, 32], y in [0, 100], z in [zlow, zhigh].for c, m, zlow, zhigh in [('r', 'o', -50, -25), ('b', '^', -30, -5)]:xs = randrange(n, 23, 32)ys = randrange(n, 0, 100)zs = randrange(n, zlow, zhigh)ax.scatter(xs, ys, zs, c=c, marker=m)ax.set_title('3D Diagram View', pad=15, fontsize='10')ax.set_xlabel('x ', color='r', fontsize='14')ax.set_ylabel('y ', color='g', fontsize='14')ax.set_zlabel('z ', color='b', fontsize='14')plt.show()结果显示为:
 文章插图
文章插图
- 想自学Python来开发爬虫,需要按照哪几个阶段制定学习计划
- 未来想进入AI领域,该学习Python还是Java大数据开发
- 锐龙5000微代码更新:超频更稳、X570无需风扇
- 小米MIUI代码泄露新机:或edmi K40
- 2021年Java和Python的应用趋势会有什么变化?
- 非计算机专业的本科生,想利用寒假学习Python,该怎么入手
- 用Python制作图片验证码,这三行代码完事儿
- 历时 1 个月,做了 10 个 Python 可视化动图,用心且精美...
- 微软称SolarWinds黑客攻击波及公司内部的源代码存储库
- 整合零代码+AI+云原生技术,「速优云」布局智慧教培和智慧社区
